PRince web server visualization tutorial
http://www.facweb.iitkgp.ac.in/~rbahadur/prince/home.html
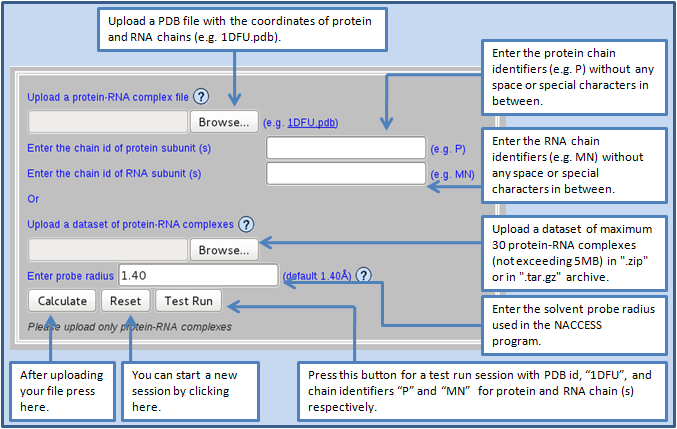
B. Users must upload a protein-RNA complex file containing the atomic coordinates of protein and RNA chains in one single file in the Protein Data Bank format (.pdb). In this case, users should enter the protein and the RNA chain identifier(s) in the respective input fields.
Alternatively, the users can also upload a dataset of maximum 30 protein-RNA complexes (not exceeding 5MB) in ".zip" or in ".tar.gz" archive. The archive should not contain any folder, instead the files should be archived directly. In this case, the users should ensure that the archive must contain an extra file named "input.txt", which includes the 4-letter PDB code of the complexes and the chain identifiers of each protein and RNA subunits in the following format:
PDBid*Protein chains*RNA chains*
e.g.: 1DFU.pdb*P*MN*
The first column of this file represents the PDB identifier of the complex, the second column represents the protein chain identifier(s), and the last column represents the RNA chain identifier(s). Each column must be separated by "*". This input file must contain "n" number of rows for "n" number of complxes in the archive file.
The users can also control the size of the solvent probe radius used in the NACCESS program to calculate the solvent accessible surface area.
The example shown here with a complex involving ribosomal protein L25 and 5S rRNA fragment (PDB id, 1DFU).
The program generally takes 10 seconds to print the output data for an average size protein-RNA complex. The calculations can take around a minute for a dataset of 30 protein-RNA complexes. The programs can handle up to eight protein chains and eight RNA chains with a maximum limit of 20,000 amino acids and 20,000 nucleotides respectively. For the dataset with multiple protein-RNA complexes, users can download the results in a zip archive file.
C. After a few seconds of uploading the data, a table with information about the structural and physicochemical parameters of the protein-RNA interface is loaded at the bottom of the query form. It also displays the PDB file name and chain identifiers submitted by the users under "Input" section.

Under the output section, it generates four files: (1) 1DFU_P.int (2) 1DFU_R.int (3) 1DFU_int.pdb and (4) 1DFU_wat.int. Users can download all these three files as well as visualize these in Jmol plugin. Users should go through the instruction button for the installation of Jmol.
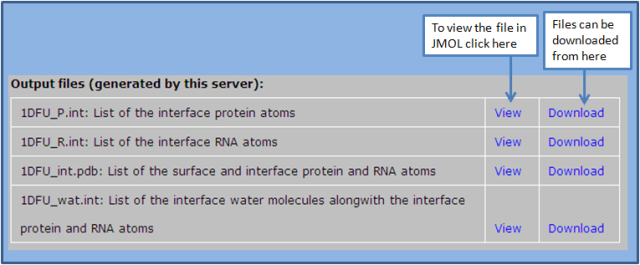
The details of these three files are given below:
(1) 1DFU_P.int: It contains the list of the interface atoms (in PDB format) from the protein chains.
(2) 1DFU_R.int: It contains the list of the interface atoms (in PDB format) from the RNA chains.
(3) 1DFU_int.pdb: It contains the list of surface and interface atoms of both protein and RNA chains. Here all the protein surface atoms are assigned chain identifier X, all the RNA surface atoms are assigned chain identifier Y and the interface atoms from protein and RNA are assigned chain identifier Z. This file can be viewed in Jmol viewer, where it shows the surface and interface atoms in different colours.
(4) 1DFU_wat.int: It contains the list of interface water molecules along with the interface protein and RNA atoms. The chain identifier of the interface water molecules is Z, while that of protein atoms is A and RNA atoms is B.
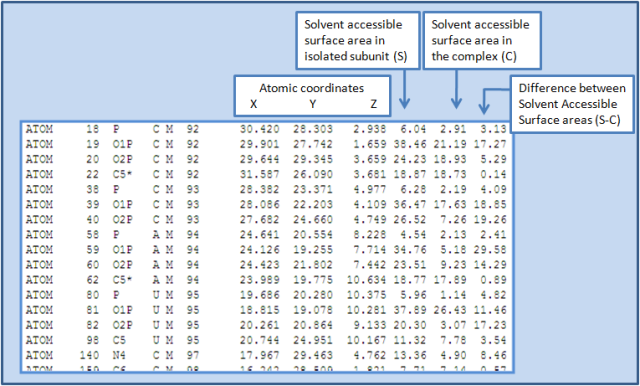
A sample (taken from 1DFU_R.int) output file is shown below.
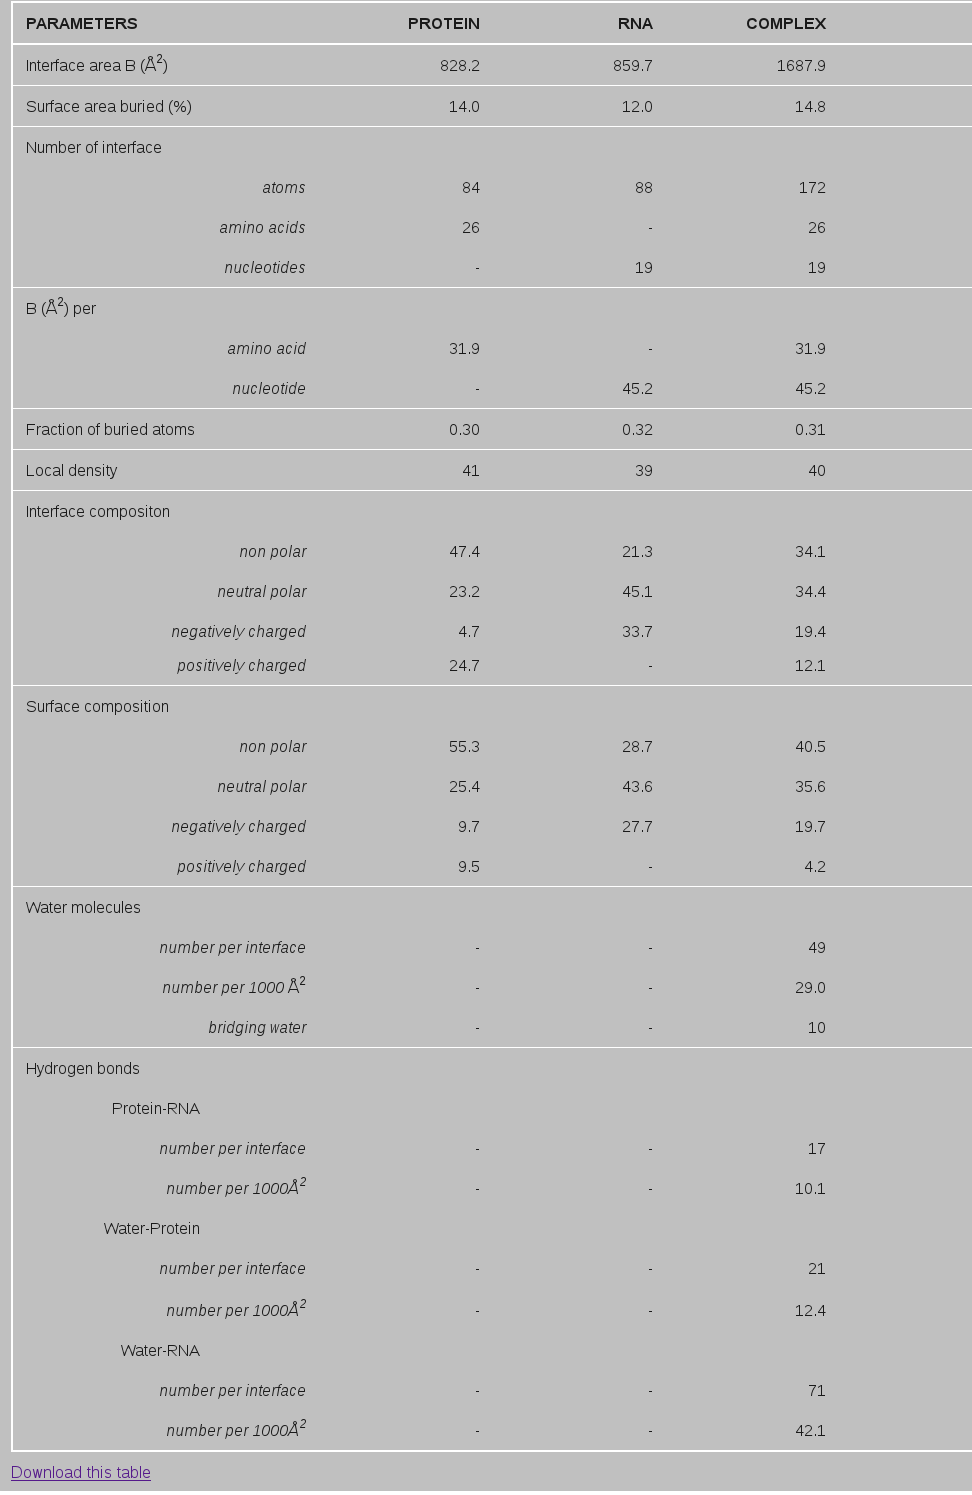
D. A typical example (from 1DFU.pdb) of output parameters is shown in the Table below.
Interface area
The interface area is the sum of the solvent accessible surface area (ASA) of the protein and RNA chains less that of the complex. This can be given by the following equation
B=ASAprotein + ASARNA - ASAcomplex (1)
ASAprotein and ASARNA are the solvent accessible surface area (ASA) of protein and RNA respectively and SASAcomplex is the same for the complex. The ASA is calculated by using the program NACCESS (Hubbard SJ 1992). All the atoms (from amino acids and nucleotides) that loose solvent accessibility in the complex and contribute to B are considered as interface atoms. The number of interface atoms, amino acids and nucleotides are shown in Table1.
BSA per amino acid (or nucleotide) represents the interface area contributed by each of the interface amino acid (or nucleotide).
The ratio of the Interface area to the rest area of the solvent accessible surface is expressed as Surface area buried (in percentage) and can be calculated by the following equation:
Surface area buried (%)=Interface area/rest area of the solvent accessible surface (2)
Fraction of buried atoms
Depending on their spatial distribution, the interface atoms can be divided into two different categories. Those which are not accessible by any solvent molecules (with ASA = 0) are called fully buried interface atoms, and those which are still accessible to solvent molecules at the interface are called partially buried (Bahadur et al., 2004). The atomic packing of the interface is quantified by the following equation:
fbu = number of fully buried interface atoms / total number of interface atoms (3)
Local density
Local atomic density (LD) index is used to measure the overall density of the interface as described by Bahadur et al., (2004). In brief, for each interface atom i, the number ni of the interface atoms that were within a distance 12 Å of atom i in the same subunit was counted. LD is the average of ni over all N interface atoms and is given by the following equation:
LD = Σi (ni) / N (4)
Interface/Surface composition
The interface/surface composition is divided into four different types: (a) nonpolar (b) neutral polar (c) negatively charged and (d) positively charged.
Protein: Nonpolar(all the carbon-containing groups);Neutral polar(O,N and S);Positively charged(N in Arg/Lys side chains);Negatively charged(O in Asp/Glu side chains).
RNA: Nonpolar(all the carbon-containing groups);Neutral polar(N,O,P are neutral polar except O1P and O2P);Negatively charged(O1P,O2P).
Hydrogen bonds
Hydrogen bonds (H-bonds) between protein and RNA groups were identified with program HBPLUS (McDonald and Thornton, 1994) using default parameters. As the number of H-bonds tends to increase with the interface size, we have normalized the number with the size of the interface. The example in Table1 below shows that 1DFU contains 10 H-bonds per 1000 Å2 of interface area.
Water molecules
Water molecules located within 4.5 Å of interface atoms of both protein and RNA sides were considered as part of the interface (Rodier et al., 2005). The number of interface water molecules depends on the size of the interface, and to overcome this, normalized value is given. 1DFU contains 49 interface water molecules (29 per 1000 Å2 of interface area). The bridging waters are identified as those interface waters making H-bond with both protein and RNA groups.
E. Users can download this table as "1DFU_param.txt" file, which can be viewed by any text editor in Windows/Linux/MacOS.
Table 1. Interface parameters of ribosomal protein L25 complexed with 5S rRNA fragment (PDB id, 1DFU)
F. Users can also download a non-redundant dataset of 81 protein-RNA complexes and their interfaces compiled by Bahadur et al., (2008a) by clicking on the Dataset button.
References:
1. Bahadur RP, Zacharias M and Janin J (2008). Dissecting protein-RNA recognition sites. Nucleic Acids Res. 36, 2705-2716.
2. Janin J and Bahadur RP (2008). Relating Macromolecular Function and Association: The Structural Basis of Protein-DNA and RNA Recognition. Cellular and Molecular Bioengineering 1, 327-338.
3. Bahadur RP, Chakrabarti P, Rodier F and Janin J (2004). A dissection of specific and non-specific protein-protein interfaces. J. Mol. Biol. 336, 943-955.
4. Rodier F, Bahadur RP, Chakrabarti P and Janin J (2005). Hydration of protein-protein interfaces. Proteins 60, 36-45.
5. McDonald IK and Thornton JM (1994). Satisfying hydrogen bonding potential in proteins. J. Mol. Biol. 238, 777-793.
6. Hubbard SJ (1992). NACCESS: A program for calculating accessibilities. Department of Biochemistry and Molecular Biology. University College of London. http://wolf.bms.umist.ac.uk/naccess/.